
Benefits of tracking artist KPIs for managers
Discover how tracking artist KPIs empowers managers to make data-driven decisions for better tours, marketing, and negotiations.

Benefits of tracking artist KPIs for managers
Tracking artist KPIs turns guesswork into repeatable decisions: which cities to tour, how much to spend on ads, when to release a single, and how to negotiate from a position of proof rather than instinct. Managers who build even a basic KPI habit report better routing, sharper campaign budgets, and stronger leverage at the negotiating table.
Get the fundamentals right and the benefits stack up fast:
- Better tour routing using city-level listener data instead of guesswork or promoter pressure
- Smarter marketing spend by identifying which ads convert casual listeners into repeat fans
- Clearer release timing based on catalogue momentum rather than gut feeling
- Revenue diversification by spotting over-reliance on a single income stream
- Negotiation leverage with venues, labels, and brand partners backed by real numbers
Platforms like Spotify for Artists, Apple Music for Artists, and Chartmetric supply most of this data for free or at low cost, and a marketplace like Music Video Marketplace can help turn the resulting insights into video content that moves the numbers further.
Key Takeaways
Tracking artist KPIs works because it replaces reactive guesswork with decisions tied to specific, measurable evidence from platforms artists already use.
| Point | Details |
|---|---|
| Pick decision-linked KPIs first | Choose three to ten metrics tied directly to a real upcoming decision, not everything a dashboard offers. |
| Prioritise saves over streams | A high save rate signals long-term revenue potential better than a raw stream spike. |
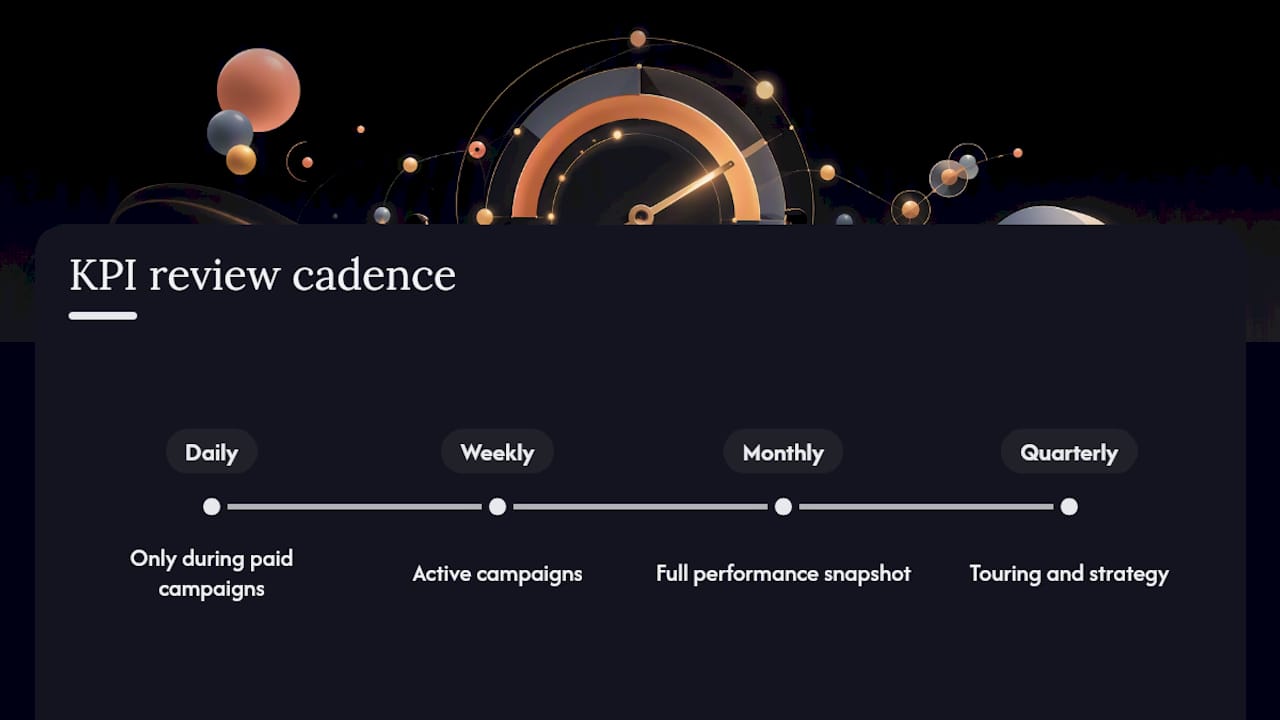
| Set a review cadence | Check campaigns weekly, run a full snapshot monthly, and revisit strategy and routing quarterly. |
| Use geography for touring | Cross-reference Spotify and Apple Music city data with fan-demand signals before booking a run. |
| Pair creative with KPI goals | Musicvideomarketplace lets managers produce and launch video campaigns aimed at lifting the exact KPIs they track. |
Table of Contents
- Why tracking artist KPIs changes career outcomes
- The KPIs that actually matter, grouped by decision
- How to measure these KPIs: platforms and data sources
- How often should you review artist KPIs?
- Common pitfalls when tracking artist KPIs
- Building a monthly KPI workflow that managers actually keep
- Using geographic data to plan a tour: a worked example
- How video creative moves the KPIs you’re already tracking
- Frequently asked questions
- Sources
Why tracking artist KPIs changes career outcomes
KPIs work because they convert vague signals (“the streams are up”) into specific operational choices (“book Manchester and Leeds, skip Glasgow this cycle”). Without that translation, managers end up reacting to whatever platform surfaced last, rather than acting on what the data actually supports.
The effect compounds over a career. Teams that track engagement metrics rather than raw counts tend to get better return on ad spend, because they can see which creative actually holds attention rather than just which one got clicks. Ticket sales become less of a gamble once routing decisions rest on where an artist’s listener base is genuinely concentrated. Catalogue performance improves too, since consistent tracking reveals which older tracks are quietly still earning and deserve a fresh push.
The trap most new managers fall into is trying to watch everything at once.
Pro Tip: Pick three KPIs tied directly to your next decision (a tour, a release, an ad campaign) before you open a single dashboard. Everything else is noise until that decision is made.
The KPIs that actually matter, grouped by decision
Not every number deserves a place on your dashboard. The useful ones sort neatly into five groups, each tied to a specific choice you’ll need to make.
Financial KPIs answer the sustainability question. Revenue per fan tells you whether your audience is monetising or just listening. Revenue by source (streaming, merch, sync, live) flags dangerous concentration in one channel. Average order value on merch or direct sales shows whether your pricing and bundling actually work, a technique borrowed from broader ecommerce and art-market analytics.

Audience and engagement KPIs measure loyalty rather than reach. Save rate, repeat listen rate, and completion rate all signal whether people are choosing to stay, not just stumbling past. Spotify’s own engagement-focused reporting now includes listener conversion metrics that show how many casual listeners turn into committed fans after a campaign, which matters more than the campaign’s raw impression count.
Marketing and campaign KPIs judge whether spend is working. Playlist adds, post-campaign listener conversion, and cost per acquisition (CPA) tell you whether a boosted post earned its budget back in actual fans, not just views.
Touring and live KPIs reduce booking risk. Top listener cities, fan-demand signals from platforms like Bandsintown or Songkick, and historical ticket sales by city let you pitch venues with evidence instead of hope.
Operational KPIs protect money you’ve already earned. Metadata completeness, PRO registration, and split accuracy sound dull until a missed registration means months of unpaid royalties.
A high save rate on a track with modest raw streams often predicts more long-term revenue than a viral spike with a low save rate. Streams fade; saves compound, because a saved track resurfaces in the listener’s own rotation for months. Actionable metrics like save rate and revenue per fan consistently outperform follower counts as a predictor of where an artist’s income is actually heading.
How to measure these KPIs: platforms and data sources
Each platform is strong at a specific job, and trying to force one tool to do everything wastes time better spent on decisions.
- Spotify for Artists — top cities, saves, and listener segments, all free and updated regularly
- Apple Music for Artists — the “Places” report for geographic concentration and Shazam data for discovery signals, also free
- Chartmetric — a paid aggregator that consolidates cross-platform data into one view, useful once you’re tracking more than two or three platforms at once
Reviewing campaign metrics across marketing channels gets far easier once the free platform reports are pulled into a single reference point.
Pro Tip: Build one Google Sheet that pulls your five to ten decision KPIs into a single monthly snapshot. Ten minutes updating one sheet beats forty minutes hopping between five dashboards.
How often should you review artist KPIs?
Cadence matters as much as the metric itself. A sensible rhythm: daily for active campaign alerts, weekly for short-term campaign checks, monthly for a full performance snapshot, and quarterly for routing and strategy decisions. Orphiq’s guidance suggests roughly 30 minutes a month plus an hour after each release is enough for most independent artists, provided the metric list stays short.
Targets work best when tied to a real threshold rather than an arbitrary round number:
- Set save rate targets relative to your own baseline (a 15%+ save rate on a new release is a reasonable bar to justify scaling ad spend behind it)
- Set CPA limits against known merch or ticket margins, not against what a campaign “feels” like it should cost
- Track revenue-per-fan trends quarter over quarter rather than month to month, since single-month swings are usually noise
Common pitfalls when tracking artist KPIs
Chasing follower counts is the most common mistake, since followers rarely convert to revenue on their own. Over-reacting to a single-week spike is the second, usually driven by a playlist add or algorithmic push that won’t repeat. Ignoring revenue mix is the third: an artist can look busy while quietly depending on one fragile income source. The fourth is neglecting owned channels like email, the one audience a platform can’t take away.
The fix is procedural, not just attitudinal:
- Tie every metric you track to a specific decision before you look at it
- Use a 90-day view for any decision with real cost attached, never a single week
- Apply cohort analysis to separate new fans from returning ones
- Write down the decision each KPI review produced, turning reviews into experiments rather than opinions
Building a monthly KPI workflow that managers actually keep
A KPI habit only survives if it’s boring enough to repeat. Here’s a workflow that fits into an existing schedule rather than replacing it:
- Assign ownership: one person (often the manager) owns the monthly snapshot, even on a small team
- Agree the KPI shortlist together with the artist, so everyone is watching the same five to ten numbers
- Build the one-page monthly snapshot: revenue by source, save rate, top cities, CPA, email growth
- Run a short retrospective after every release, comparing actual performance to the pre-release target
- Hold a quarterly strategy session focused on routing, release calendar, and budget allocation
A useful monthly meeting runs under thirty minutes, with the manager chairing, a marketer or media buyer reporting on campaign KPIs, and whoever owns the spreadsheet presenting the snapshot cold, with no live dashboard-hunting.
Pro Tip: Automate the exports where you can (most platforms allow scheduled CSV downloads) so the meeting is spent discussing decisions, not copying numbers.
Using geographic data to plan a tour: a worked example
Here’s how the theory turns into a real booking decision. A manager pulls the top ten cities from Spotify for Artists and cross-references them against the “Places” report in Apple Music for Artists. Overlapping cities go on a shortlist. That shortlist then gets checked against fan-demand requests on Bandsintown and any past ticket sales in the region, following the approach outlined by Tools 4 Music’s fan-data workflow.
If a city shows strong streaming numbers, a healthy stack of fan-demand requests, and reasonable past ticket sales, it becomes a booking candidate rather than a hopeful guess. The manager can then estimate expected ticket sales against the venue’s break-even point before ever emailing a promoter.
That’s also where the negotiation leverage shows up. Turning up to a promoter conversation with city-level streaming data and fan-demand numbers, rather than a vague pitch about “buzz,” tends to produce better terms: lower guarantees, better door splits, or a bigger room than the promoter initially offered. The data does the persuading before the manager says a word.
Author perspective: KPIs as a creative tool, not a chore
Treating KPIs as a monthly ritual, rather than a crisis response, freed up real creative time in my first month of doing this properly. The one habit worth stealing: pick a single release-decision KPI (I used save rate) and let it, not anxiety, decide whether to keep pushing a track or move on.
How video creative moves the KPIs you’re already tracking
Completion rate, profile visits, and playlist saves rarely improve on their own. They move when the creative behind a campaign actually holds attention long enough to convert, and that’s where a properly produced video outperforms a static image ad or a lyric loop every time. A short-form clip built around the emotional hook of a track, rather than the whole song, tends to lift YouTube watch time and drive more profile visits and email signups than generic promotional assets, simply because it gives viewers something worth finishing.

Musicvideomarketplace exists for exactly this gap: managers who know which KPIs need moving but don’t have the time, crew, or budget for a full video shoot. The marketplace lets you browse and customise human-made, ready-to-edit, full-length music videos, upload your own audio and branding, and export a YouTube-ready cut in minutes rather than weeks. From there, generating short social clips for the campaign and launching an ad push behind the same asset takes one workflow instead of three separate vendors. If completion rate or profile visits are the KPI you’re trying to shift this quarter, start by browsing available music video templates and testing one against your current creative.
Frequently asked questions
What’s the first KPI a new manager should track? Start with save rate on a recent release. It’s free to access via Spotify for Artists, easy to explain to an artist, and directly predictive of whether a promotional push is worth scaling.
How often should artist KPIs be reviewed? Weekly for active campaigns, monthly for a full performance snapshot, and quarterly for touring and strategy decisions. Daily checks only make sense while a paid campaign is live.
What does a basic KPI tracking example look like? That triggers a decision to scale ad spend behind the track for two more weeks rather than moving straight to the next release.
Do I need paid tools like Chartmetric, or are free platforms enough? Free reports from Spotify for Artists, Apple Music for Artists, and YouTube Analytics cover most independent artists’ needs. Chartmetric earns its cost once you’re tracking multiple artists or need one consolidated cross-platform view.
How does video content fit into KPI tracking? Video creative directly influences completion rate, profile visits, and playlist saves, three KPIs that are otherwise hard to move through text or static-image marketing alone.
Sources
- Spotify for Artists — analytics
- KPIs for artists: the metrics that actually matter (and the ones that don’t) – SpitFireHipHop
- Music data: metrics that matter — Orphiq
- How to use fan data to make better career decisions — Tools 4 Music
- Music metrics that matter: what to track — Songkeeper
Recommended
- Music campaign metrics explained for marketers | Music Video Marketplace Blog
- Music ad campaigns: expert strategies for real results | Music Video Marketplace Blog
- Analytics en promoción musical: guía para músicos 2026 | Music Video Marketplace Blog
- Why musicians need marketing guides to grow | Music Video Marketplace Blog
Read next
 Benefits of video for artist acquisition: 2026 guideDiscover the benefits of video for artist acquisition. Learn how video transforms listeners into loyal fans and boosts engagement.
 Benefits of video for beat licensing: 2026 guideDiscover the benefits of video for beat licensing in our 2026 guide. Boost sales, enhance trust, and reduce copyright issues. Learn more!
 Best Music Videos Of 20252025 was a year of unforgettable music videos. From high-energy club vibes to emotional storytelling, these top 10 videos show how artists are pushing creativity — and now you can get professional videos for your own music instantly.
 The Future Is Visual: Music Video Marketplace at ADE 2025Music Video Marketplace is heading to Amsterdam where CEO Loraa White will host a panel titled “The Future Is Visual” The session will explore how video and AI are shaping the future of music. Plus, exclusive ADE offers include 25% off all videos and a chance to win a free music video,
Turn the idea into a finished music video.
Drop your track into the Studio and build your visual in minutes.