
Music campaign metrics explained for marketers
Discover how to measure success with music campaign metrics explained. Learn the key indicators that truly engage your audience!
Music campaign metrics explained for marketers
TL;DR:
- Focusing on engagement metrics like saves and skip rates provides deeper insights into true audience connection than raw streams or follower counts. AI-driven tools and owned fan data strengthen targeting, helping optimize campaigns and reduce budget waste. Applying behavioral signals to campaign strategy enhances growth potential and ensures more effective, data-informed decisions.
Most music marketers look at streams and follower counts and call it a day. That is a mistake. Music campaign metrics explained properly reveal something far more useful: whether your audience is genuinely connecting with the music or just scrolling past it. The difference between a campaign that builds real momentum and one that burns budget on vanity numbers comes down to knowing which metrics actually matter, what they mean in context, and how to act on them. This guide covers exactly that.
Table of Contents
- Key takeaways
- Core music campaign metrics defined
- AI-driven tools and advanced analytics
- Behavioural signals and vanity metrics
- Metrics for live performance marketing
- Applying metrics to campaign strategy
- My take on music analytics
- How Musicvideomarketplace supports smarter campaigns
- FAQ
Key takeaways
| Point | Details |
|---|---|
| Streams alone mislead | Raw streaming numbers tell you nothing about audience engagement quality or campaign effectiveness. |
| Behavioural signals are predictive | Save rate, repeat listens, and skip rate are far better indicators of long-term algorithmic growth. |
| AI tools sharpen targeting | AI-driven platforms now deliver measurably higher clickthrough and conversion rates than traditional promotion. |
| Live metrics need separate attention | Ticket sales velocity is a distinct KPI that predicts attendance and informs pricing before it is too late. |
| Platform-native tools cover most needs | Spotify for Artists and YouTube Studio handle the majority of your data requirements without complex add-ons. |
Core music campaign metrics defined
Before analysing music campaign performance, you need a shared vocabulary. These are the metrics that appear consistently across platforms, and the ones most often misunderstood.
Clicks measure how many times someone tapped or clicked on your ad, profile link, or playlist placement. On their own, clicks only tell you that something attracted attention. They say nothing about what happened next.
Clickthrough rate (CTR) is the ratio of clicks to impressions, expressed as a percentage. A high CTR indicates that your creative or copy is resonating with the audience it reaches. A low CTR against a large impression count means you are paying for eyeballs that are not interested.
Saves are one of the most underrated metrics in music marketing. When a listener saves a track to their library, they are signalling genuine intent. It costs them nothing, yet they chose to act. Saves and repeat listening are substantially better predictors of organic growth than broad ad impressions.
Skip rate measures how quickly listeners abandon a track. A skip within the first thirty seconds is particularly damaging because it tells the algorithm the content is not delivering on its promise.
Repeat listens show that a listener returned to the track voluntarily. This is perhaps the clearest signal of genuine resonance. Algorithms reward it accordingly.
Follower growth matters most when it correlates with engagement. A thousand new followers who never stream, save, or attend a show are worth less than two hundred who do all three.
Consumptions refer to total streams or video views within a campaign window. Useful as context, but never as a standalone measure of success.
- Clicks and impressions = awareness-level data
- Saves, skips, and repeats = engagement-level data
- Follower growth and conversions = loyalty and demand data
Pro Tip: Track your save-to-stream ratio as a quick health check. If streams are climbing but saves are flat, your campaign is reaching the wrong audience or the track is being consumed passively rather than actively chosen.
AI-driven tools and advanced analytics
Understanding music analytics has shifted considerably. The platforms and tools available today go well beyond spreadsheet exports and passive dashboards.

AI-powered promotion platforms have recorded 44% clickthrough rates on artist profiles, alongside a 30% conversion rate from free to paid customers for labels using their tools. Those are not hypothetical benchmarks. They reflect what happens when targeting is guided by behavioural data rather than demographic guesswork.
For audience intelligence at scale, the most effective music marketing stacks combine Chartmetric for trend tracking and market positioning with direct fan-connection platforms such as email and SMS lists, plus tools like Bandsintown for live audience development. Each layer serves a different function.
Chartmetric tells you where your audience is growing and which playlists are driving it. Email and SMS give you a direct line that no algorithm can interrupt. Bandsintown connects streaming listeners to live events.
The critical point about owning your fan data is this: social media algorithms change without notice, and an artist who has built a 50,000-strong email list is far less vulnerable than one who relies entirely on a platform’s reach. Building owned assets should be a non-negotiable part of any music campaign.
Algorithms across Spotify, YouTube, and TikTok have shifted their prioritisation. Engagement quality metrics such as watch completion, repeat listens, and saves now carry more weight than raw exposure. This is not a secondary concern. It is the operating principle of modern music promotion.
Pro Tip: When selecting analytics tools, limit yourself to three or four total. Platform-native analytics such as Spotify for Artists and YouTube Studio cover roughly 80% of essential data needs. Add one audience intelligence tool and one fan-connection platform. More than that creates noise, not clarity.
Behavioural signals and vanity metrics
This is where music campaign metrics explained properly can save you significant budget. Vanity metrics are numbers that look impressive in a report but do not correlate with real campaign outcomes.
Here are the four most common traps:
- Total streams as a success metric. Streams measure consumption, not connection. A track can rack up streams through playlist placement and still have a 70% skip rate before the thirty-second mark.
- Social media follower counts. An account with 200,000 followers and 0.3% engagement is performing worse than one with 8,000 followers and 12% engagement. Follower count without engagement data is meaningless.
- Impression volume. Reaching a million people who are not your audience is not a win. It is budget waste dressed up as scale.
- Ad spend as a proxy for effort. Spending more does not fix a targeting problem. It amplifies it.
The metrics that actually predict long-term growth are different. Skip rates within 30 seconds indicate poor retention, while save rates and repeat listens predict lasting algorithmic favourability. These are the numbers worth building your reporting around.
One of the most practically useful insights in music promotion effectiveness analysis comes from combining metrics. A high save rate paired with a high skip rate tells a specific story: listeners are interested enough to save the track, but something in the intro is causing them to drop off early. That is a production note as much as a marketing note. Fix the intro. Reduce the skip. Watch the algorithm respond.
Pro Tip: Set up a simple reporting template that places save rate and skip rate side by side for every campaign. This single comparison will surface more useful creative decisions than any other metric pairing.
Metrics for live performance marketing
Live music operates on its own metric logic, and it is worth treating separately from digital streaming campaigns.
Ticket sales velocity is the single most important KPI for promoters and booking teams. It measures how quickly tickets sell after going on sale. A fast early velocity suggests strong demand and gives the marketing team permission to scale spend confidently. A slow start is an early warning: either the routing is wrong, the pricing is off, or the campaign has not reached the right audience yet.
| Metric | What it measures | When it matters most |
|---|---|---|
| Ticket sales velocity | Speed of ticket sell-through post-announcement | First 48 hours after on-sale |
| Geographic concentration | Where buyers are located | Show routing and regional ad spend |
| Demographic breakdown | Age, gender, listening behaviour of buyers | Targeted re-marketing and content decisions |
| Conversion from streams to tickets | How many local streamers buy tickets | Market viability for new cities |
| Repeat attendees | Fans who attend multiple shows | VIP and loyalty programme development |
Dynamic AI-driven pricing adjusts ticket costs in real time based on demand signals, improving both revenue and seat utilisation. What is less discussed is how this same data feeds back into campaign strategy. If tickets in Manchester are selling fast while Leeds is lagging, that is a signal to reallocate ad spend, not just adjust prices.
Even independent artists and smaller promoters can now access concert booking data and live event metrics that were previously available only to major labels and large venues. The analytics tools have matured significantly.
Applying metrics to campaign strategy
Knowing what your metrics mean is one thing. Applying them to actual campaign decisions is where most teams either execute well or lose weeks of momentum.
Here is how to connect the data to real decisions:
-
Local market targeting. Cross-reference your streaming data by city with ticket sales data. Cities where you have strong streams but low ticket conversion are prime candidates for local ad spend and regional press outreach. The audience exists. They just need a stronger reason to show up.
-
Retargeting based on engagement. Listeners who have saved your track or watched more than 70% of a music video are warm. Run retargeting campaigns specifically at this segment rather than broad prospecting. The conversion rate will be considerably higher, and the cost per result lower.
-
Content decisions driven by skip data. If your pre-save campaign is generating clicks but your skip rate on the track itself is high, the problem may not be the campaign. It may be the audio quality, the mix, or the intro structure. Targeted promotion focusing on audience behaviour and platform habits consistently outperforms broad advertising precisely because it accounts for these nuances.
-
Adjusting ad creative based on CTR. If one ad variant has a CTR of 2.1% and another is at 0.4%, do not run them at equal budget. Kill the underperformer fast and put the budget behind what is working. This sounds obvious, but many campaigns run A/B tests for two weeks without acting on the results.
-
Scaling what saves. Your highest-save tracks should drive the majority of your ad spend. These are the tracks the algorithm already wants to push. Help it along.
For music video campaigns specifically, boosting video engagement on YouTube requires understanding watch completion rate as the primary metric, not views.
My take on music analytics
I have watched artists and labels chase stream counts for years while the real story was sitting in their engagement data, untouched. In my experience, the biggest shift in mindset is moving from “how many people heard this?” to “how many people chose to come back?”
The artists who grow consistently are not necessarily the ones with the biggest ad budgets. They are the ones who learn quickly. A skip rate spike tells them something is wrong. A save rate surge tells them something is working. They respond to both within days, not weeks.
I am also sceptical of the idea that more tools equals better analysis. I have seen teams running six analytics platforms simultaneously and still making decisions based on gut feeling because the data is too fragmented to read clearly. Start with your native platform dashboards. Add one audience intelligence tool. Build the habit of reading the data before you spend more money.
The combination that I find genuinely useful is pairing engagement metrics from streaming platforms with direct fan data from email lists. One tells you how strangers are responding. The other tells you how fans are behaving. Together, they give you a complete picture. And for music ad campaigns, that picture is what separates informed decisions from expensive guesses.
— Music
How Musicvideomarketplace supports smarter campaigns
When you understand your campaign metrics, the next challenge is having assets that perform. Musicvideomarketplace was built specifically for this moment. The platform enables musicians to create professional long-form videos in minutes, ready to upload directly to YouTube and launch as an ad campaign for their song.

Rather than spending weeks in post-production before you can even begin testing creative, you can move from track to live campaign rapidly and start gathering real performance data. That speed matters because the best metrics insights come from iteration, not from a single perfect launch. Explore the full range of professional music videos available on Musicvideomarketplace and give your next campaign the visual assets it needs to perform.
FAQ
What are the most important music campaign metrics?
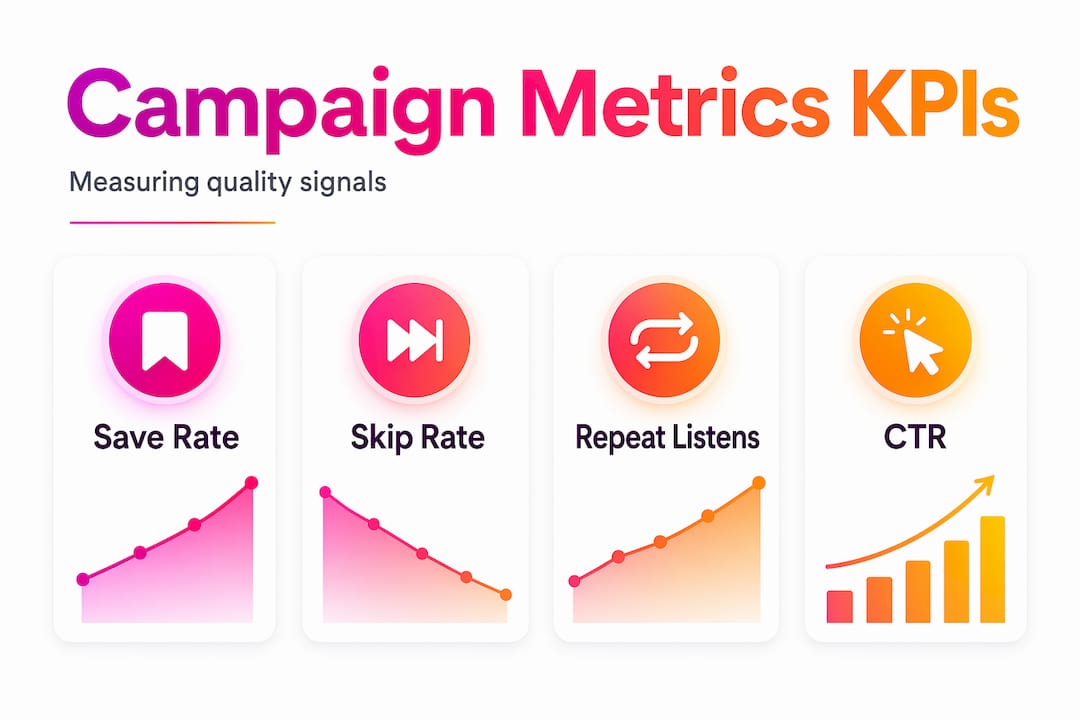
Save rate, skip rate, repeat listens, and clickthrough rate are the four metrics that most directly indicate campaign quality. Raw streams and impression counts provide context but should not be used as primary success measures.
How do I measure music campaign performance effectively?
Combine platform-native tools like Spotify for Artists and YouTube Studio for engagement data with one audience intelligence platform such as Chartmetric. Focus on behavioural signals rather than surface-level exposure numbers.
What is a vanity metric in music marketing?
A vanity metric is a number that looks impressive but does not predict real outcomes. Follower counts, total impressions, and raw stream volumes are common examples when used without accompanying engagement data.
How does skip rate affect a music campaign?
Skip rates within 30 seconds signal poor listener retention and reduce algorithmic favourability on platforms like Spotify. A high skip rate can suppress playlist placement and organic discovery regardless of how much you spend on promotion.
Why is ticket sales velocity important for live music?
Ticket sales velocity predicts final attendance and tells promoters early whether to increase marketing spend, adjust pricing, or reconsider routing. Acting on this data in the first 48 hours after on-sale can be the difference between a sold-out show and a half-empty venue.
Recommended
- Music ad campaigns: expert strategies for real results | Music Video Marketplace Blog
- Creative video campaign examples for independent musicians | Music Video Marketplace Blog
- The song marketing funnel explained for indie artists | Music Video Marketplace Blog
- Examples of song ad campaigns for independent musicians | Music Video Marketplace Blog
Read next
 Music marketing trends shaping success for independent artistsDiscover the top music marketing trends shaping success for independent artists in 2026, from video strategies to AI tools and fan community building.
 Music promotion in 2026: how the industry evolvedDiscover the evolution of music promotion 2026, focusing on algorithmic discovery and community engagement for artists to thrive in a saturated market.
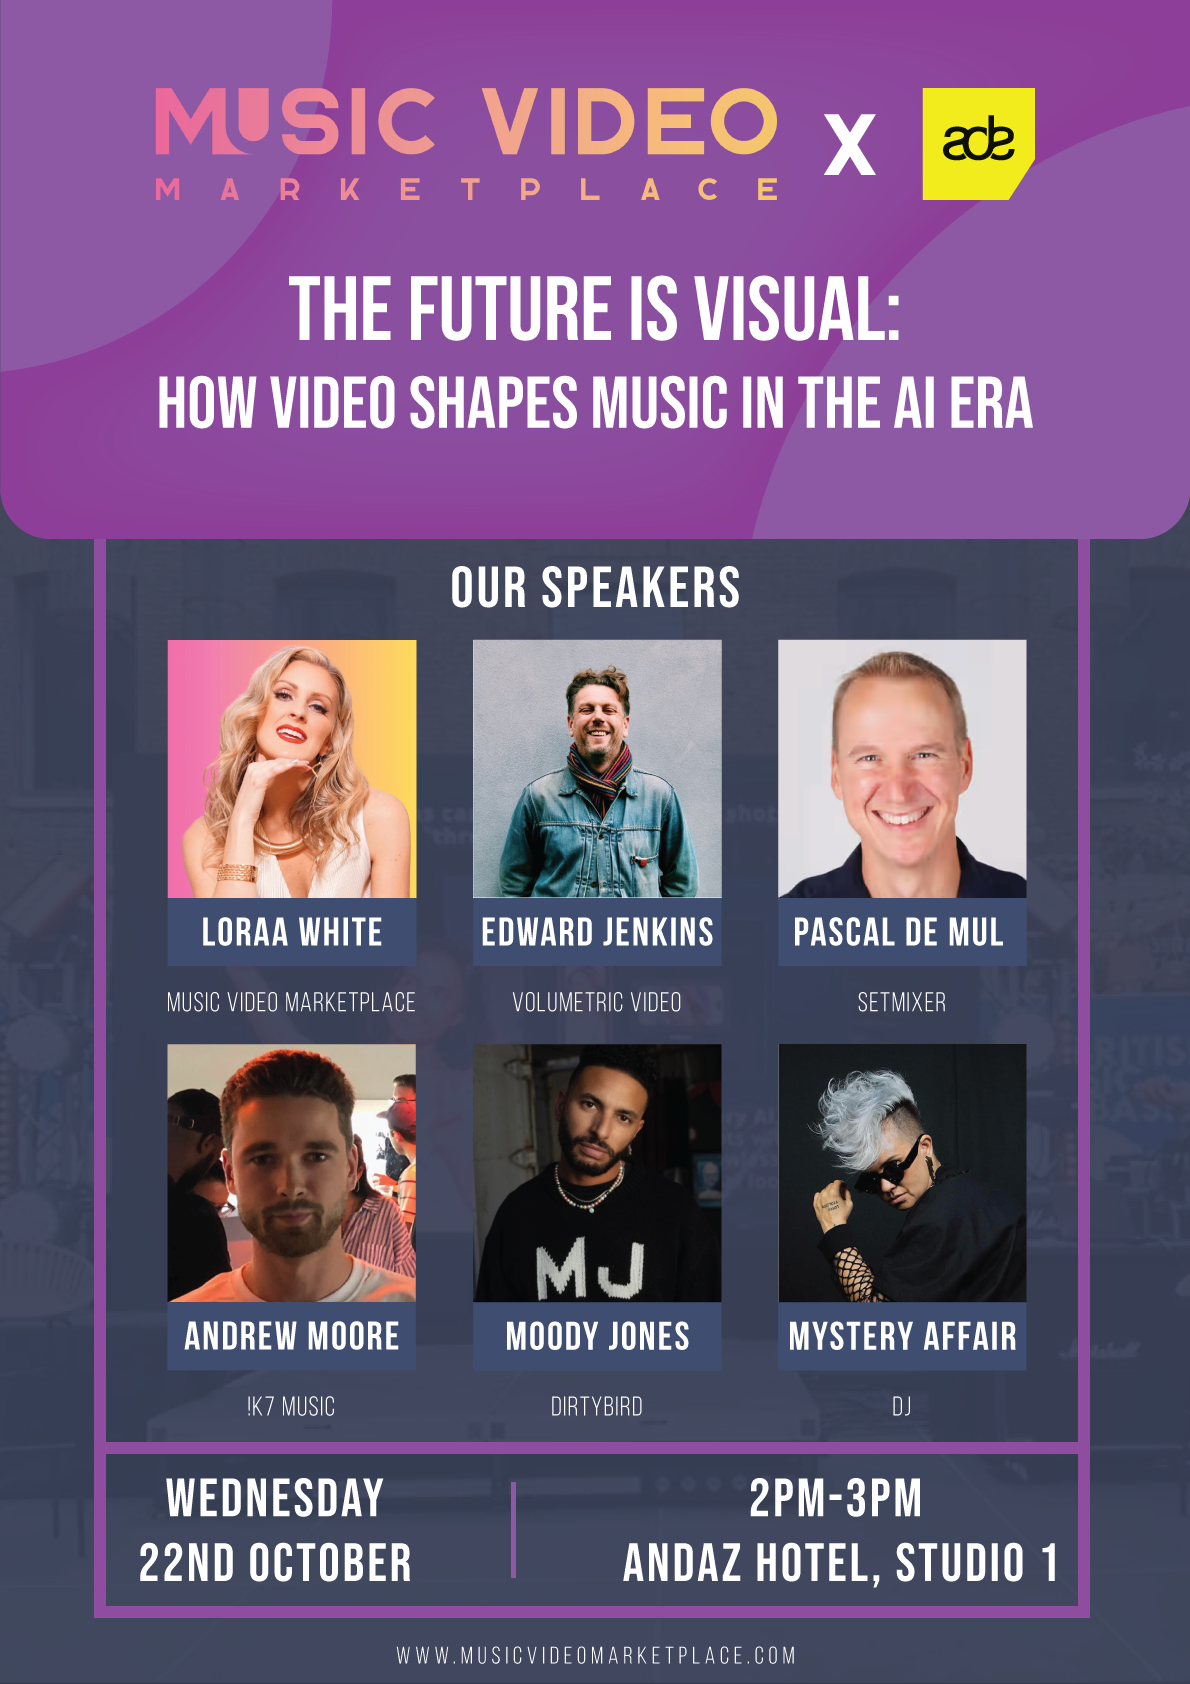 Music Video Marketplace Takes the Stage at ADE AmsterdamMusic Video Marketplace made waves at ADE Amsterdam, hosting a panel on AI, creativity, and the power of human-made music videos. CEO Loraa White and industry experts shared insights, live demos, and inspiration at the Andaz Hotel during the four-day event.
 Many Thanks And Seasons GreetingsA Christmas and New Year message from Loraa, Judith, Jacque, Erica, and the Music Video Marketplace team, reflecting on a rewarding 2025 and looking ahead to an exciting 2026.
Turn the idea into a finished music video.
Drop your track into the Studio and build your visual in minutes.